Process
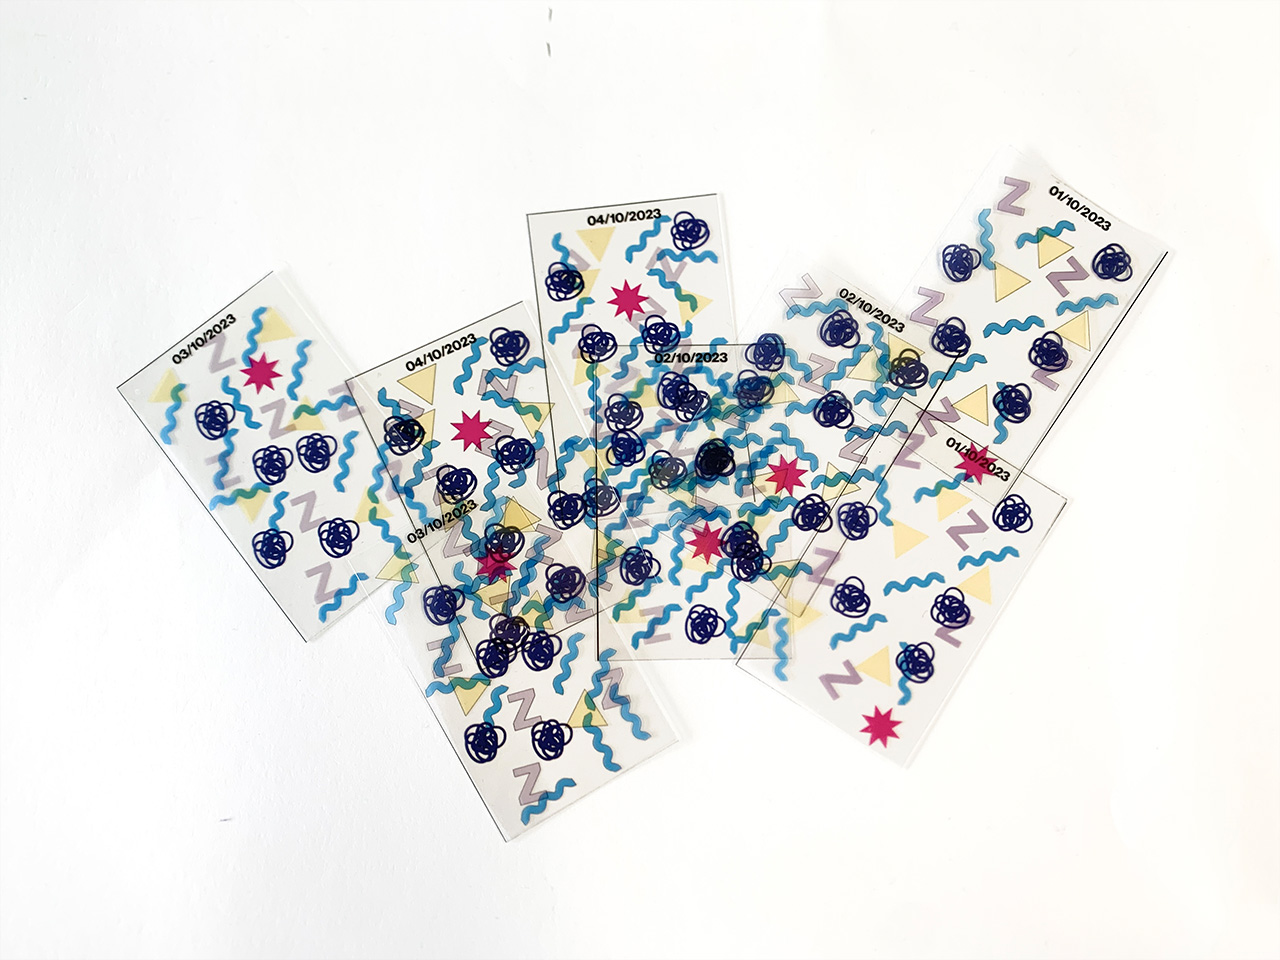
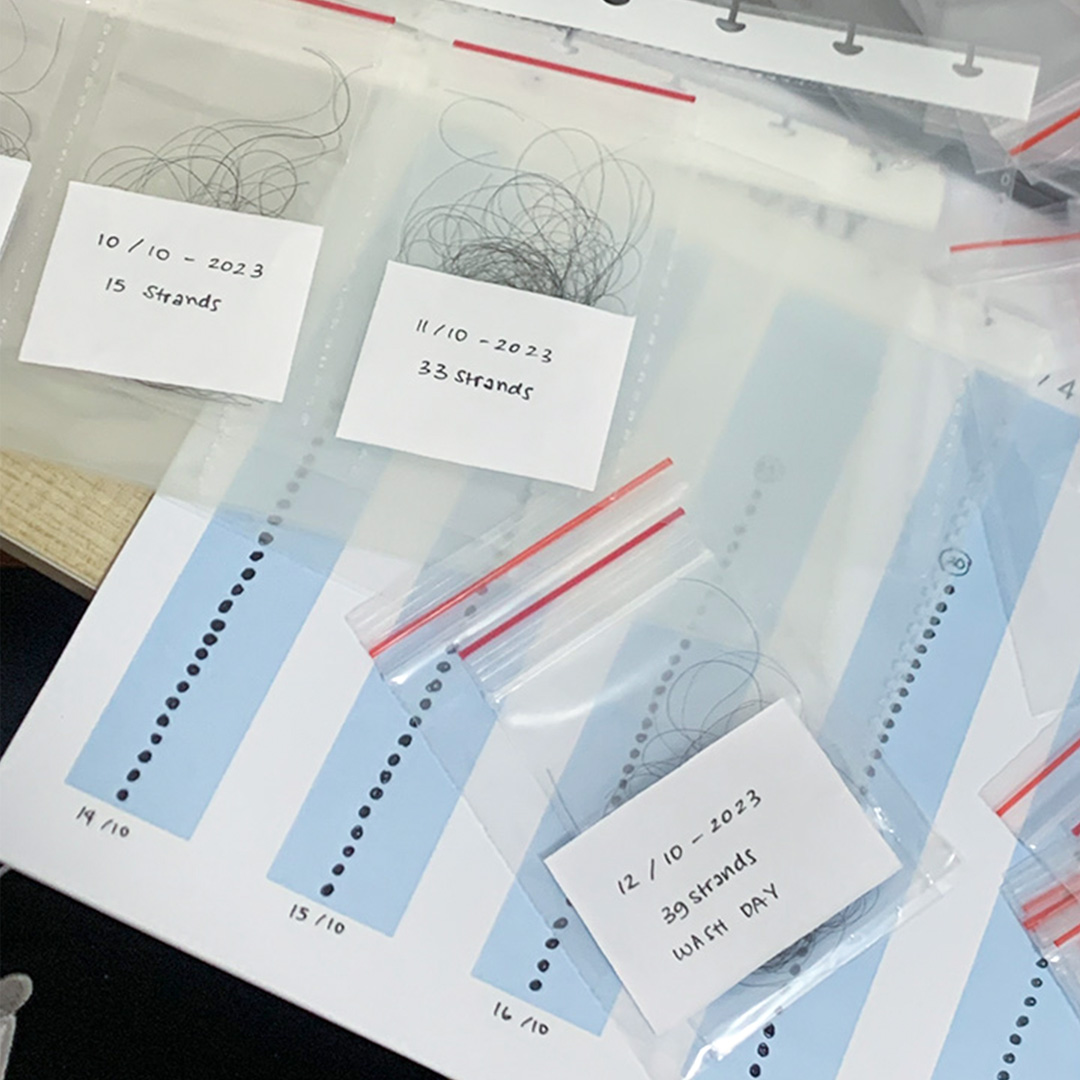
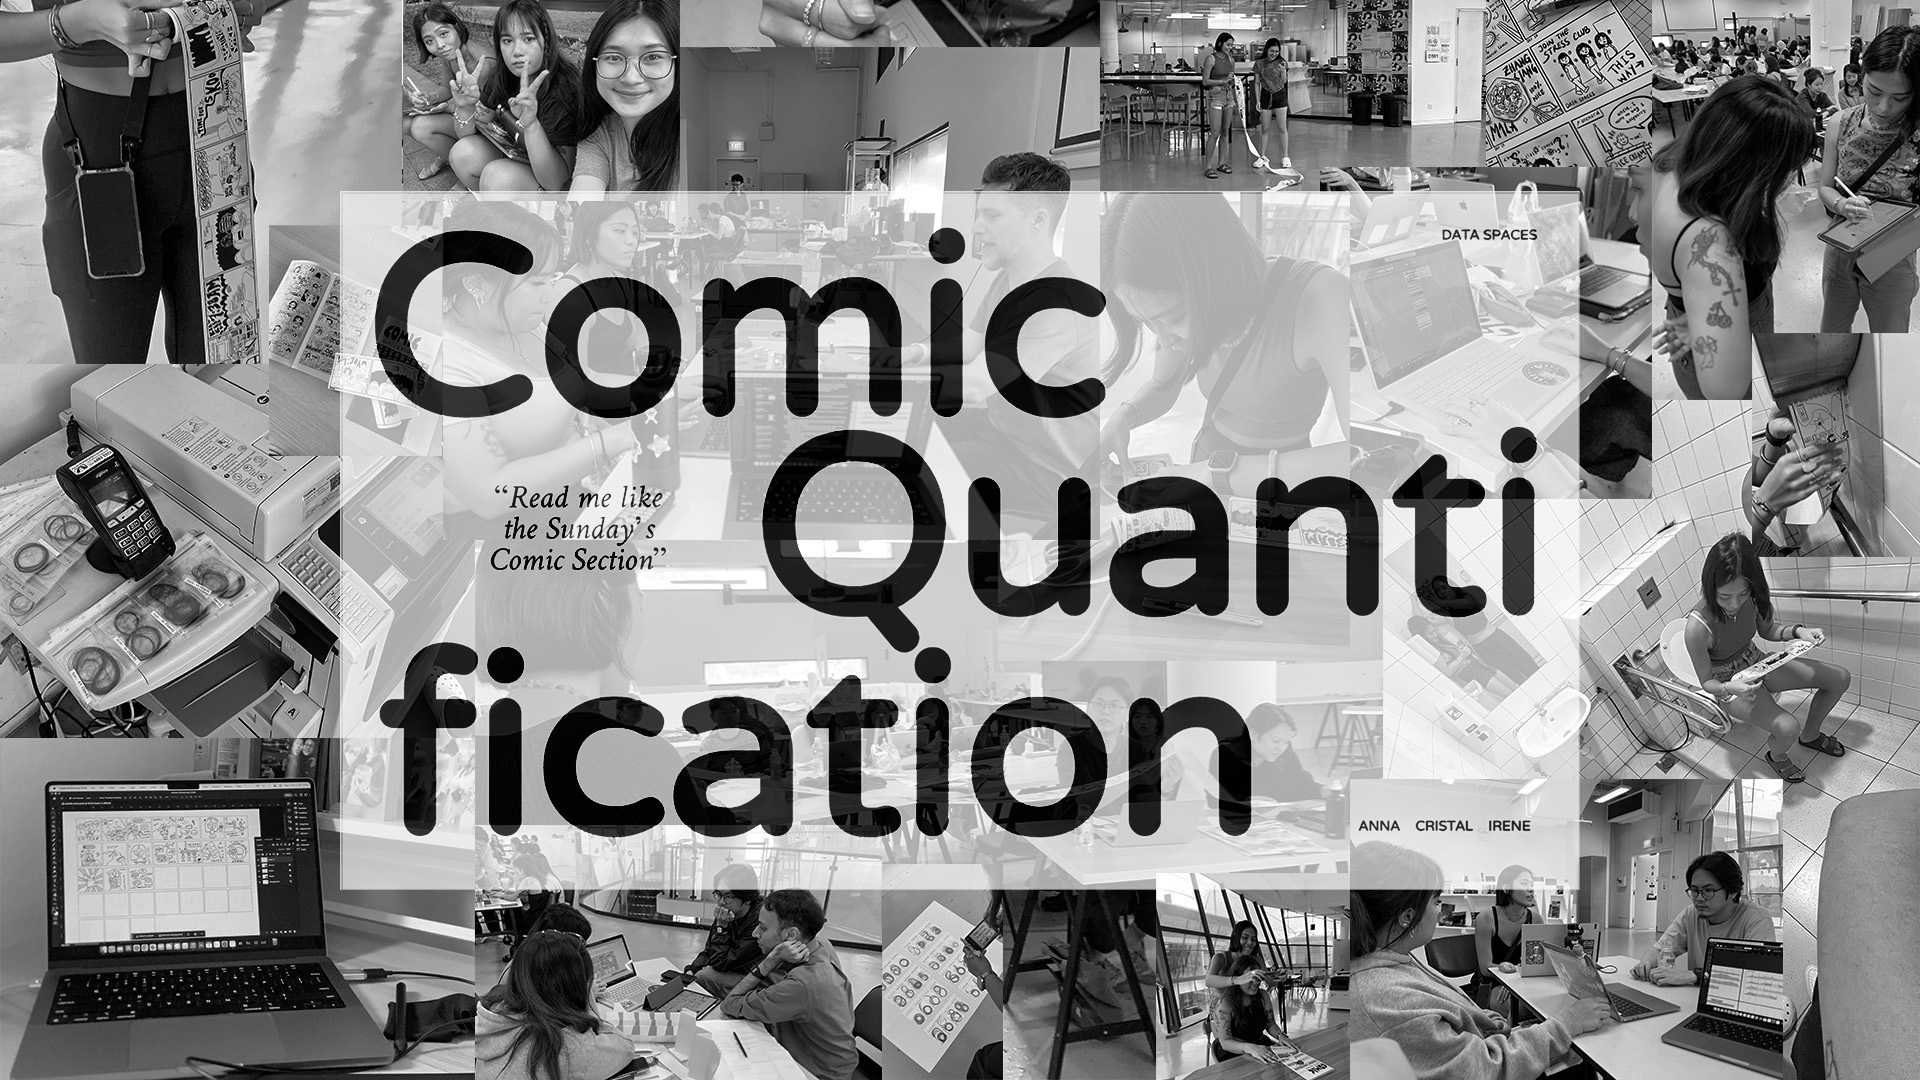
The process started with us trying to connect our data to our overall health, but it was tough finding the perfect artefact that wasn’t too “Pinstagram.” Our first attempt, doodling on transparency film and keeping it with our hairfall, turned into an abstract mess.
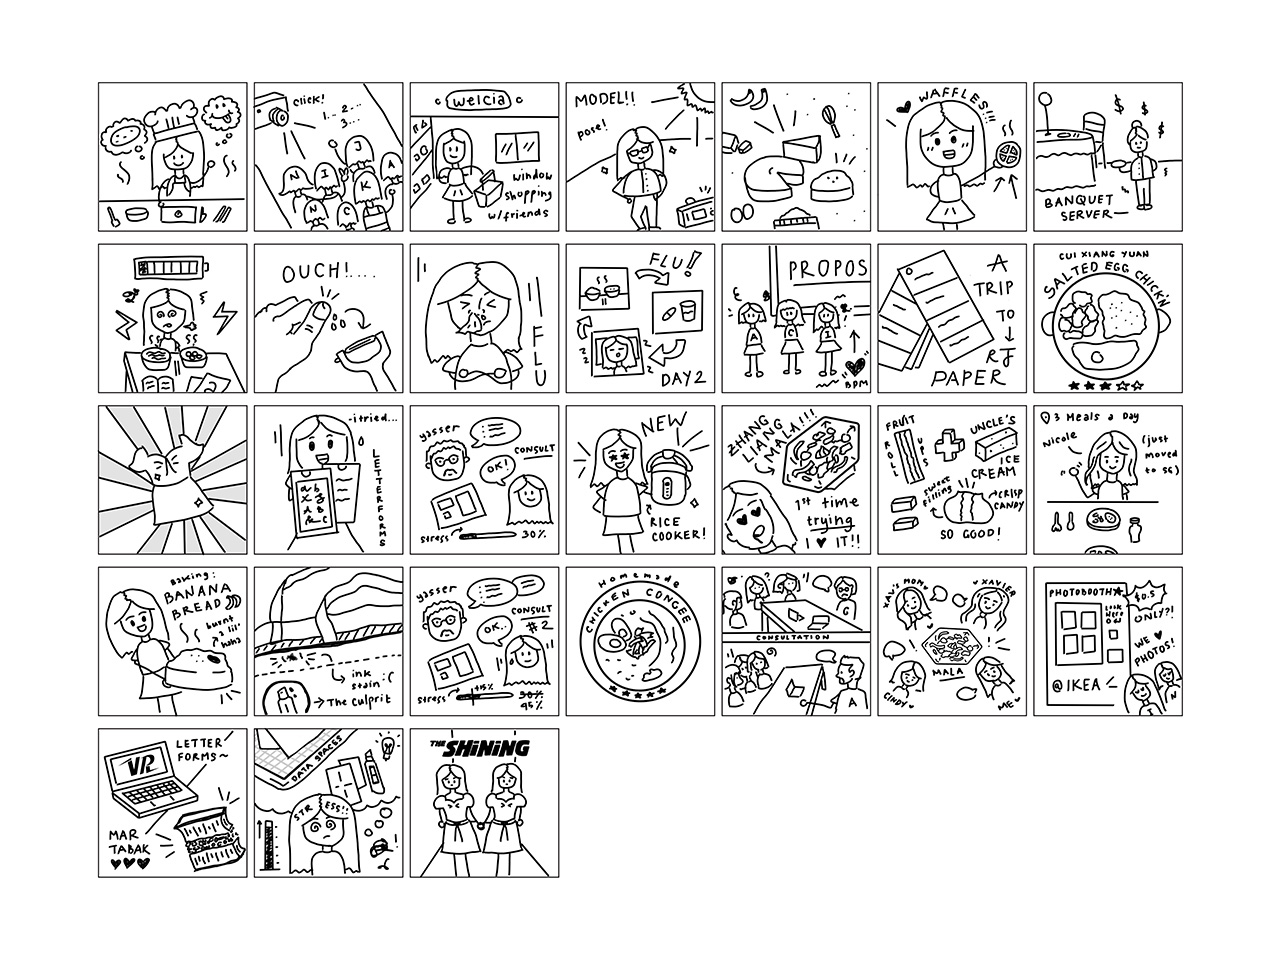
Feeling stuck, Andreas suggested sketching our data collection experiences, capturing each day in a box. Inspired by Gideon and Vikas, we turned this into a three-section comic strip—morning, day, and night—with icons and colors representing our data. This visual narrative summed up our entire October.
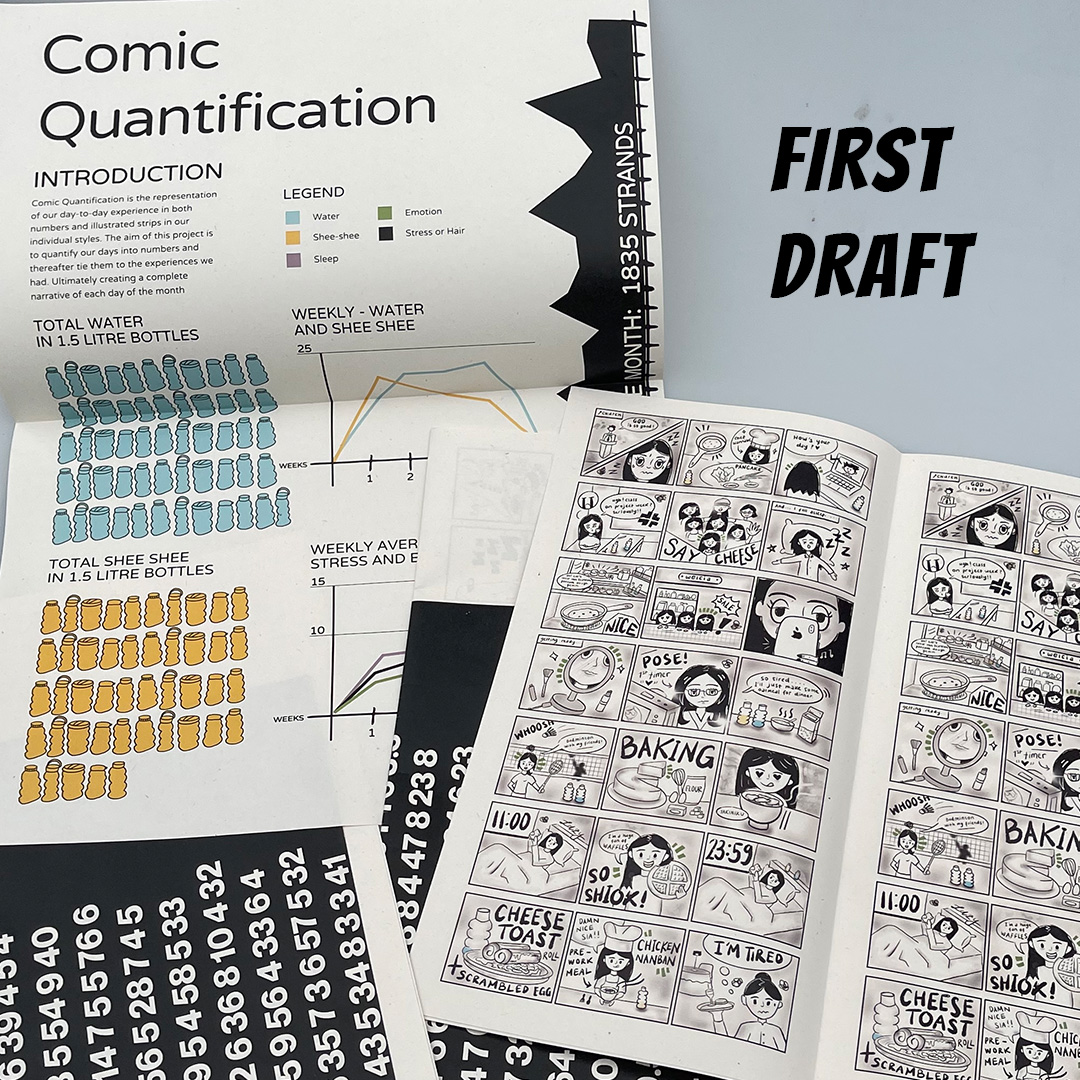
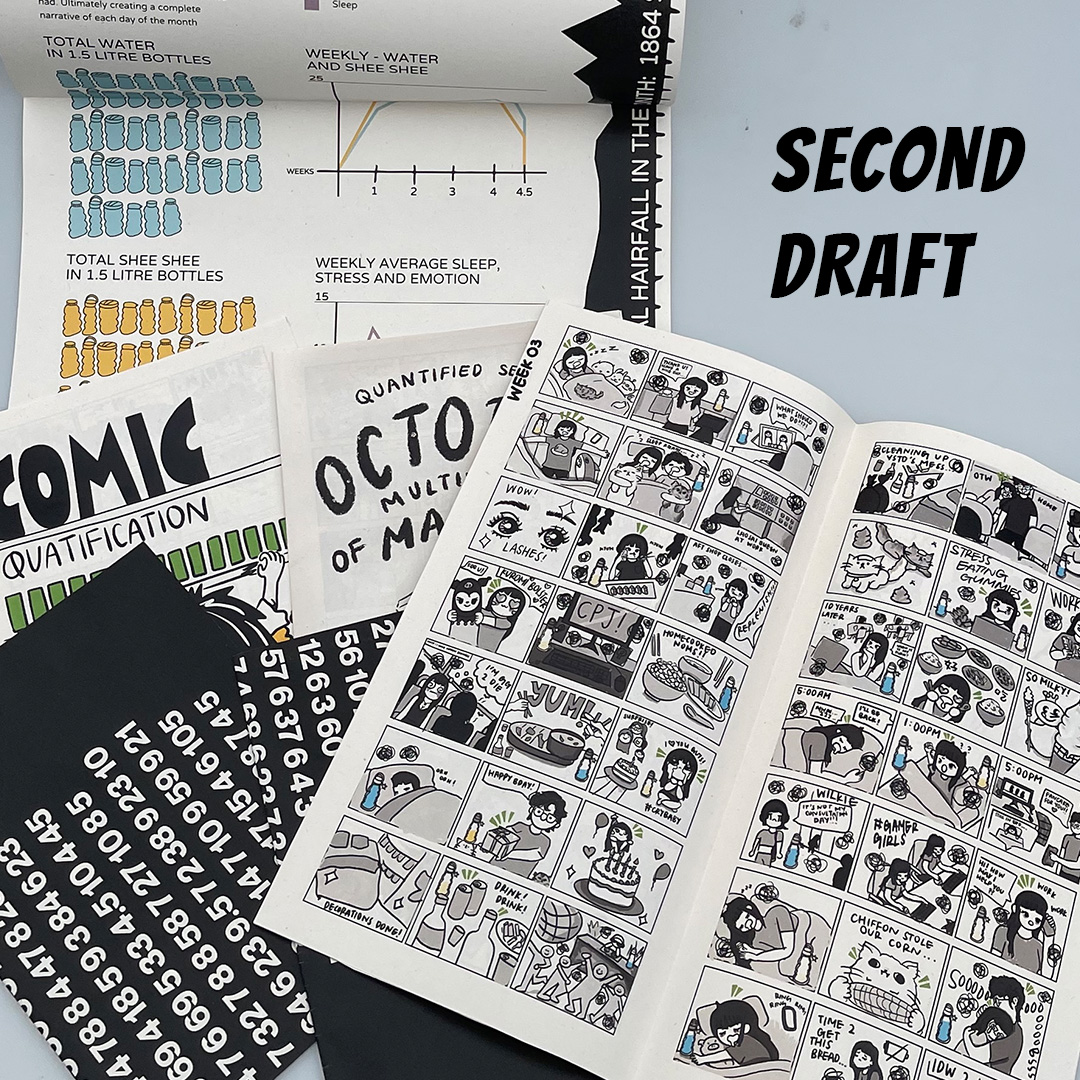
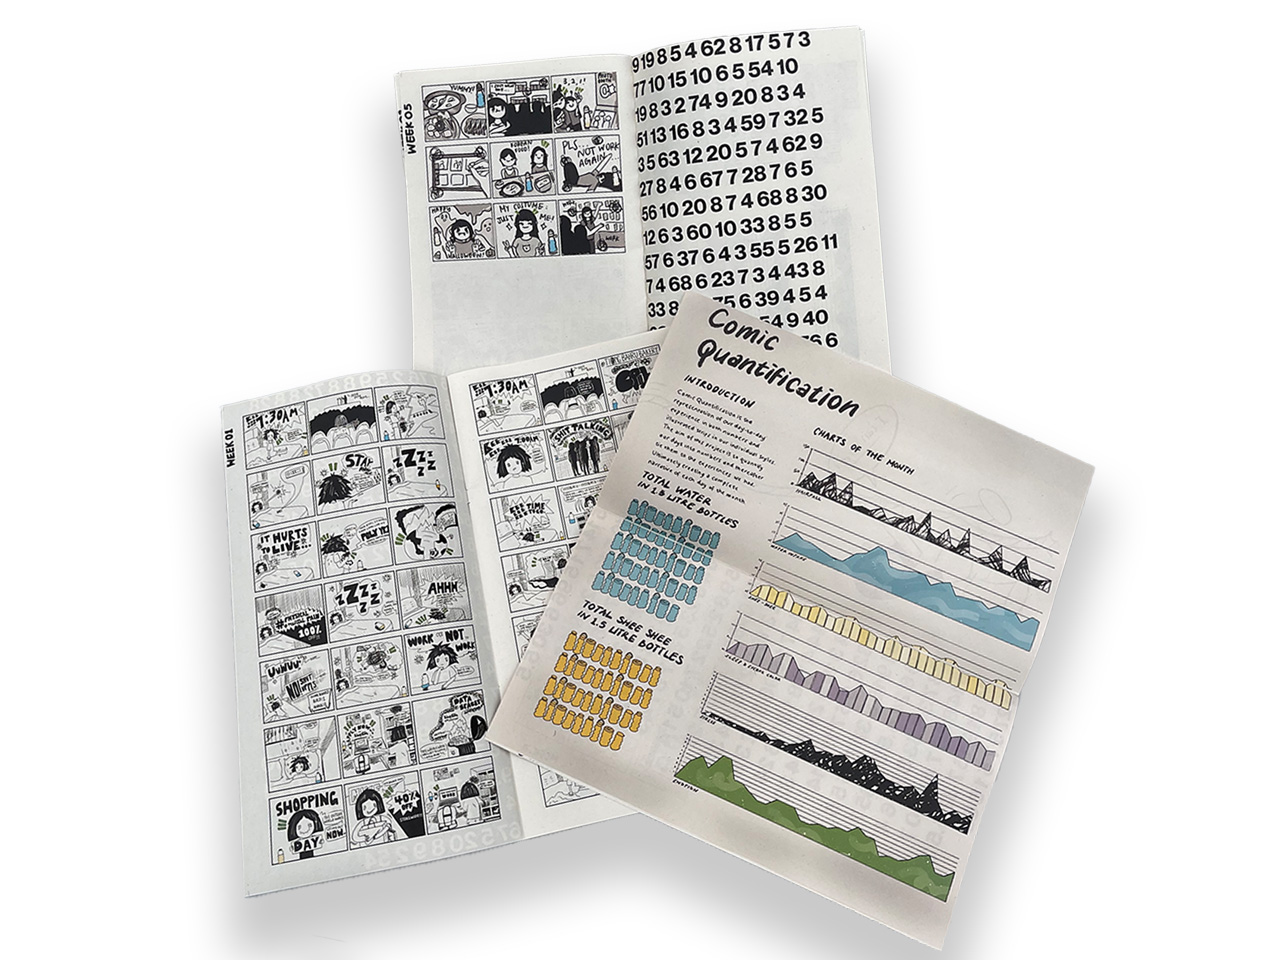
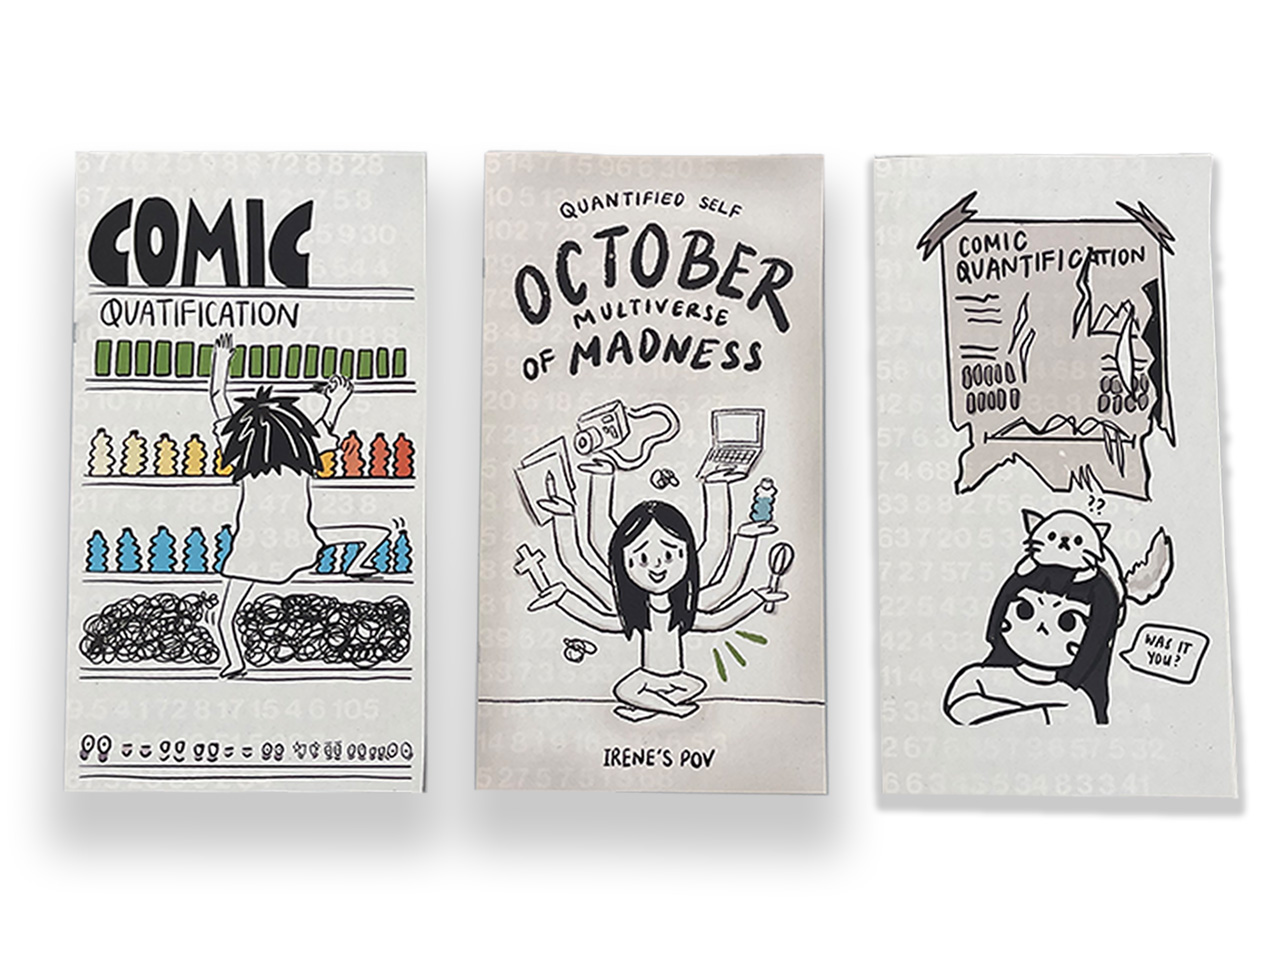
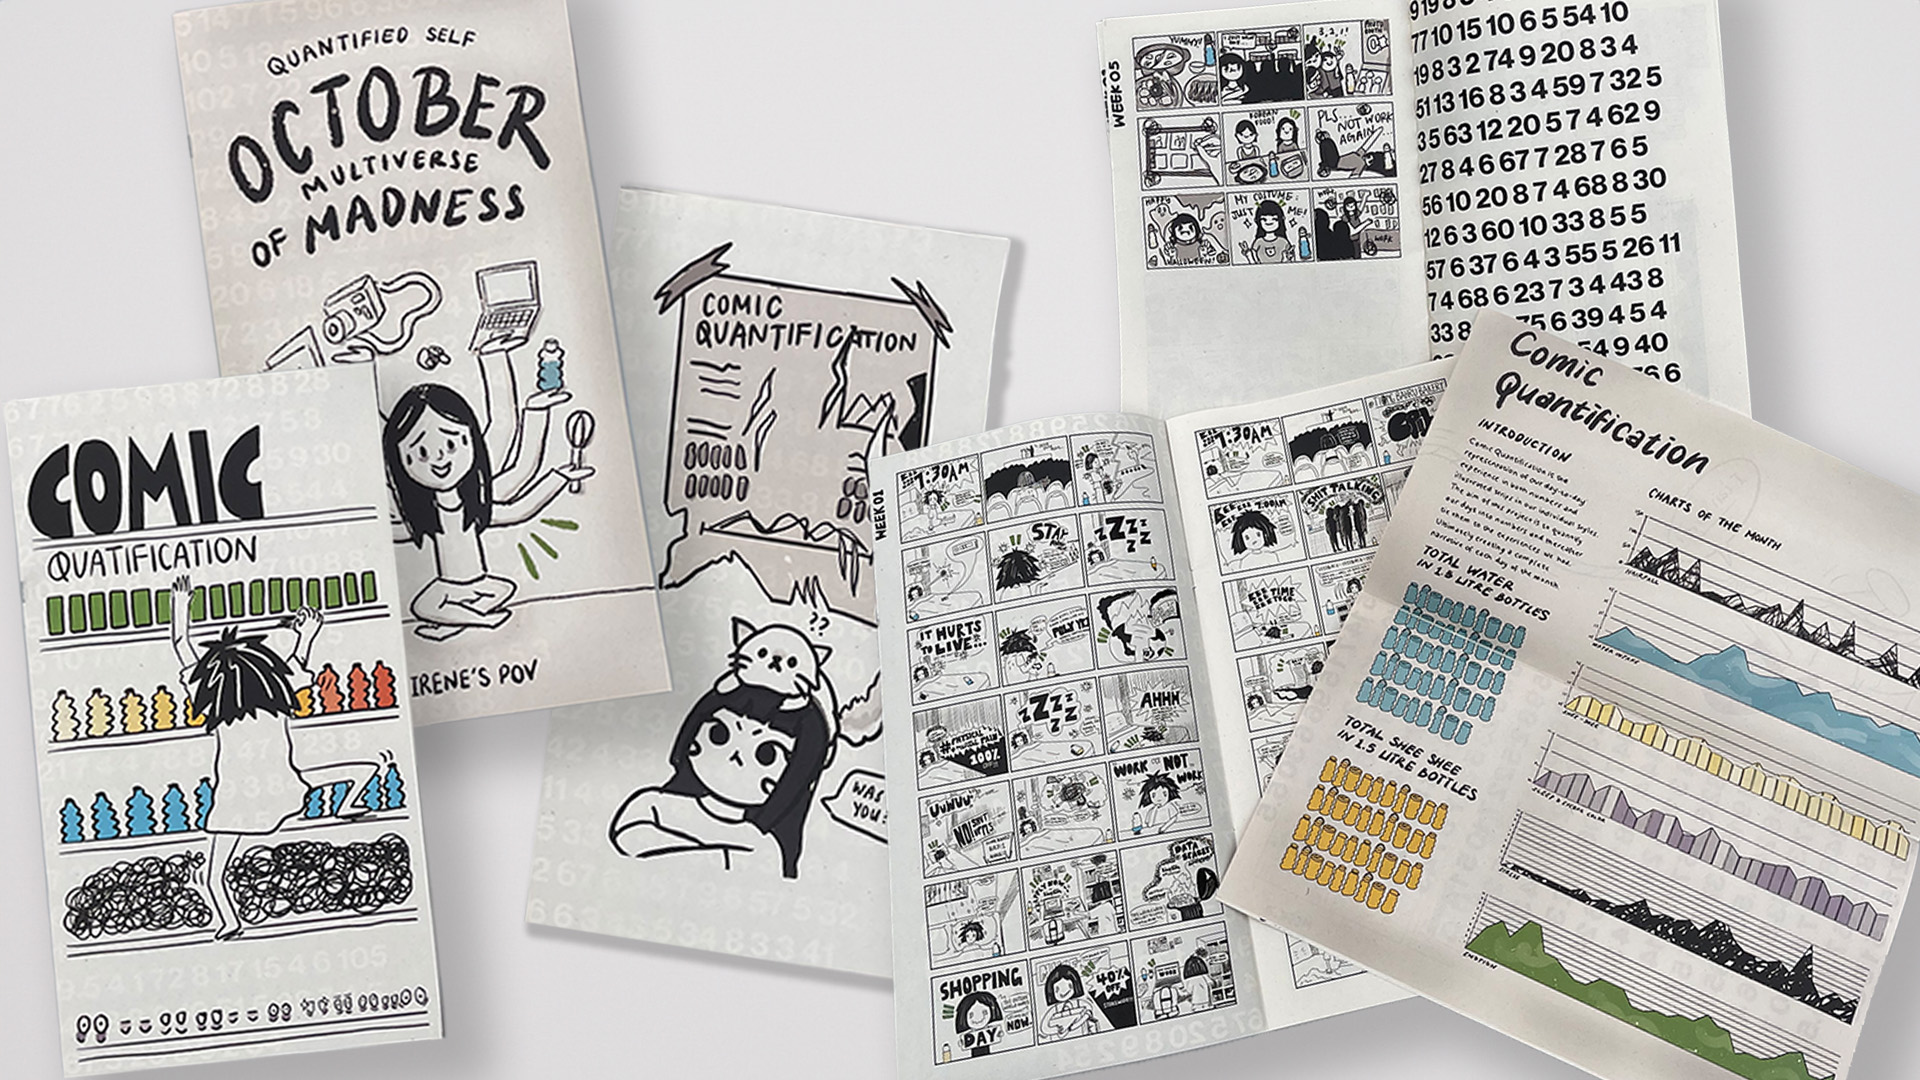
We combined these into a comic book, including numerical designs and a data compilation poster. Following Gideon's advice, we made a consolidated comic book and manually transformed the poster on an iPad for a cohesive look.
The final publication not only tells our data story but also signifies resilience, creativity, and a joint commitment to healthier living.
Proposal, background
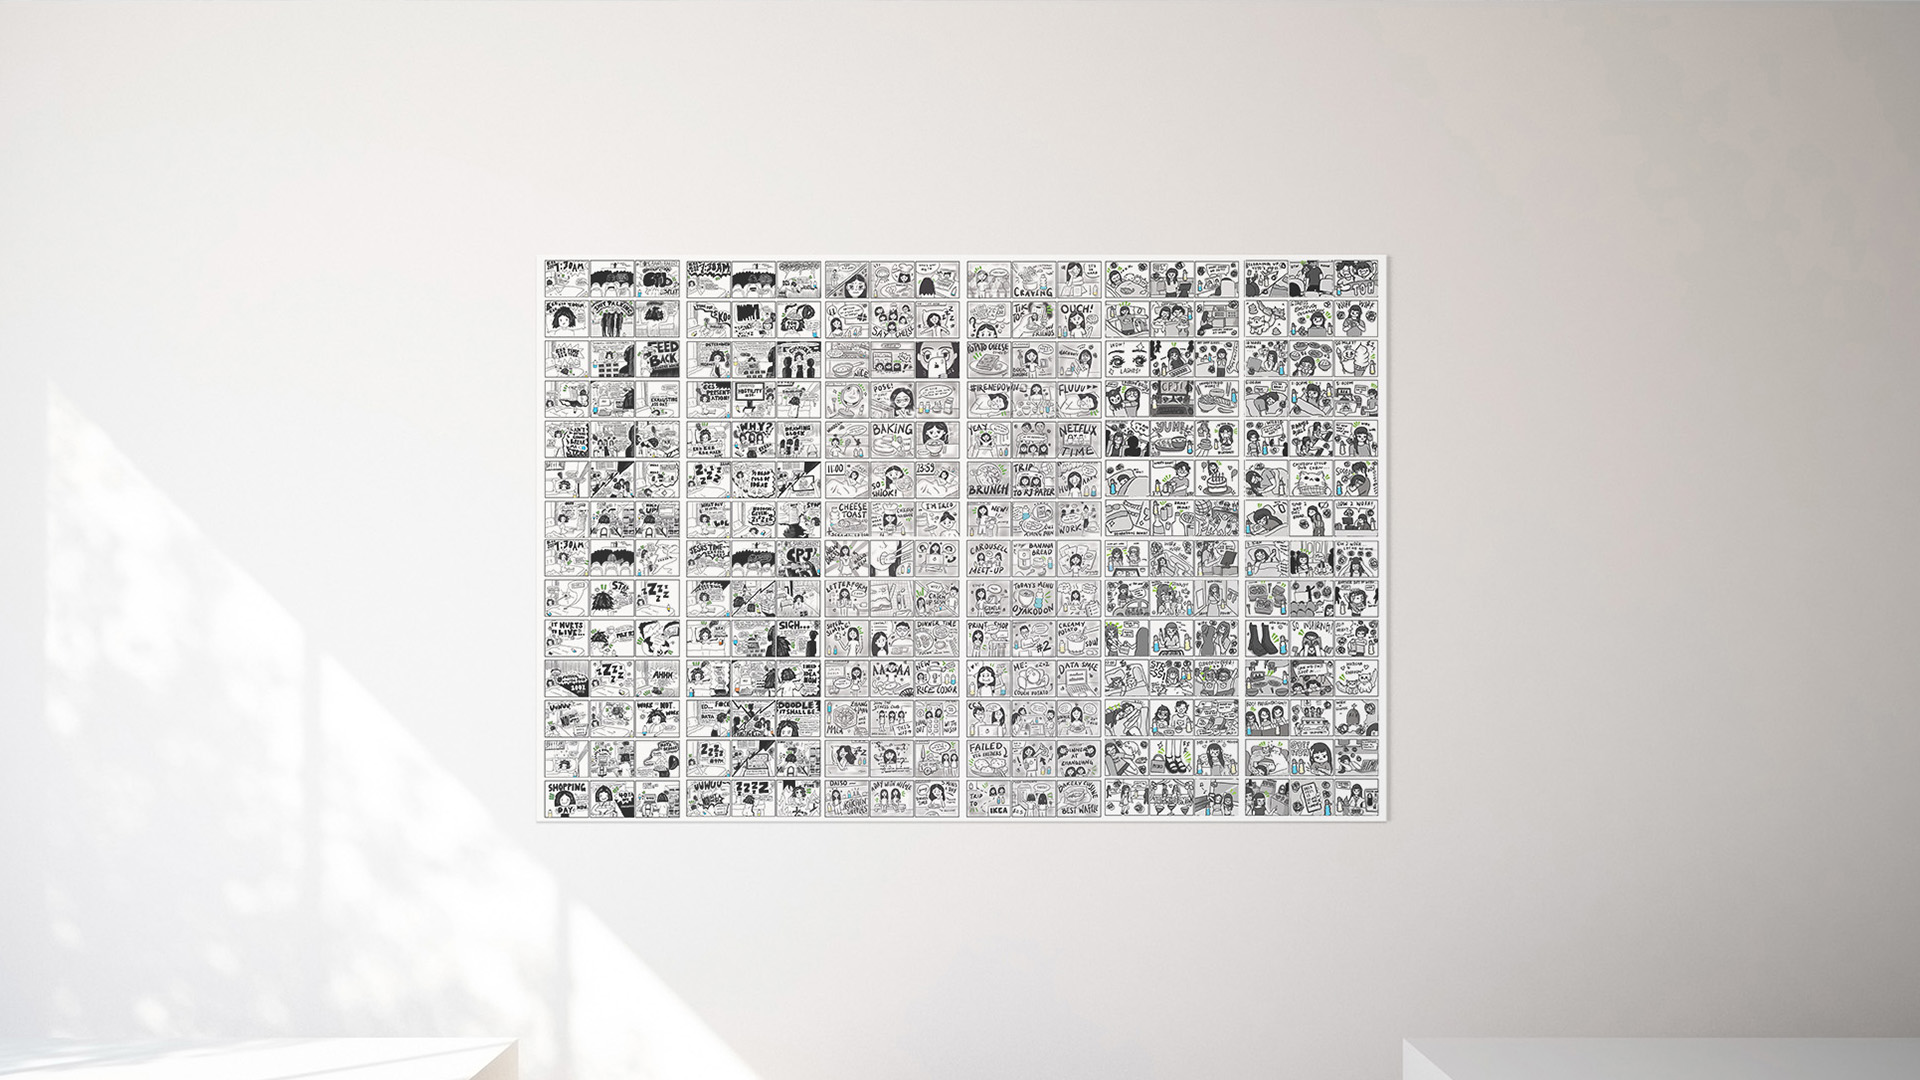
Comic Quantification is a unique fusion of personal data and artistic expression, capturing daily experiences through numbers and illustrated strips. Originally intended to connect self-quantified data to overall health, we shifted to visual storytelling as the primary narrative. Our individual styles illustrate the nuances of each day, creating a dynamic tapestry of emotions, health status, and activities.
The project serves as a captivating and holistic record, inviting viewers into the intimate intersection of data and art. This innovative approach transforms mundae statistics into a vibrant, personalized narrative, enriching our understanding of daily life.
Proposed objective
The objective of our project is to document daily life in an innovative way by combining numerical data and personalized illustrations. This project aims to assign numerical values to various aspects of each day, such as mood, health status, and social interactions. These numerical representations will be seamlessly integrated into illustrated strips, each of which will reflect our distinct artistic style.
The ultimate goal is to create a comprehensive and visually appealing narrative for each day of the month, providing a unique perspective on the ephemerality and richness of individual experiences through a dynamic interplay of numbers and art.
Proposed approach
Our project's approach involves collecting data on a daily basis, tracking various metrics such as urine frequency and color, fluid intake, emotional and stress levels, sleep duration, and hair fall.
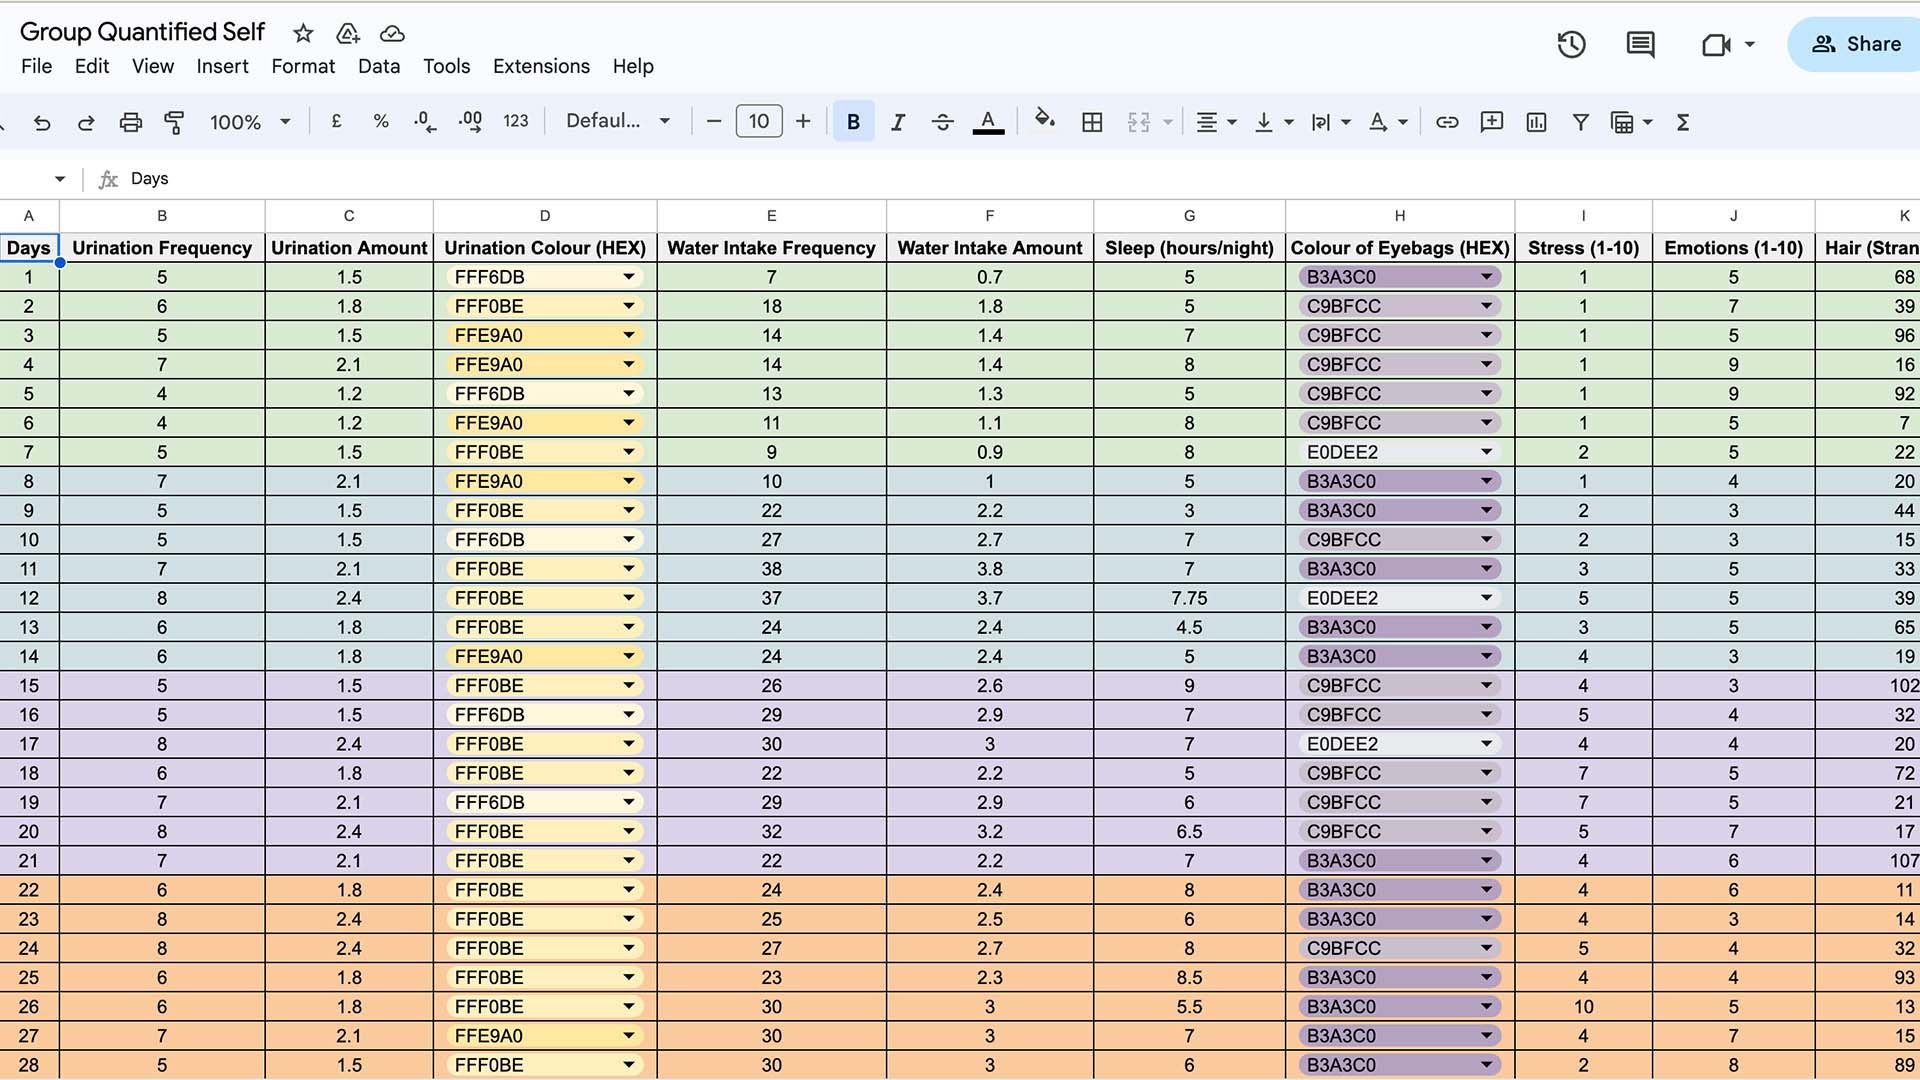
The data is entered into a structured template before being transferred to a spreadsheet for analysis. From there, we create morning, afternoon, and nightly comic strips that depict their own highlights and experiences for the entire month of October.
The gathered data is skillfully incorporated into these comics to create a comprehensive story that accurately portrays the variety of facets of everyday life.
Data collected
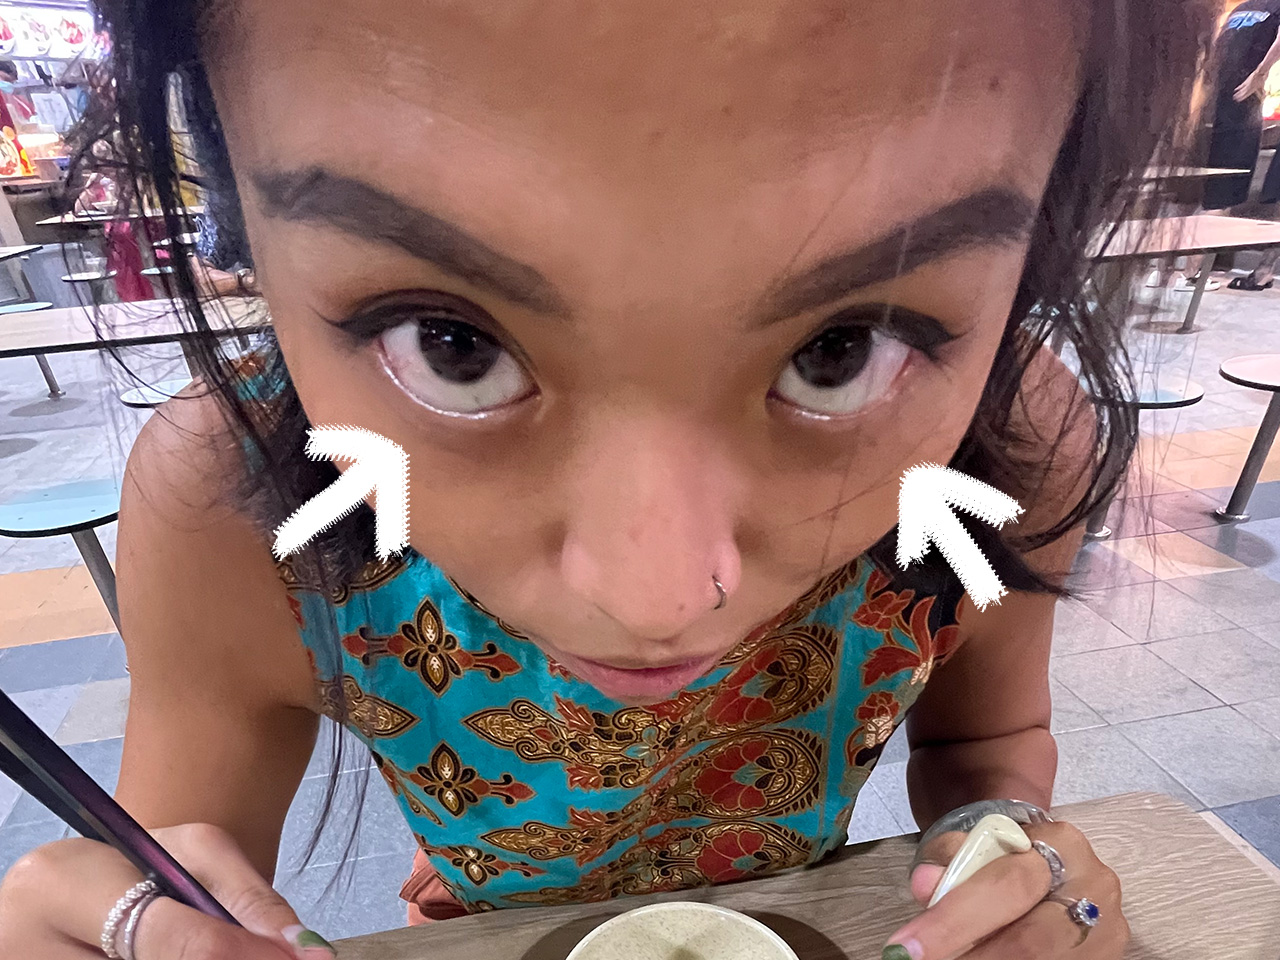
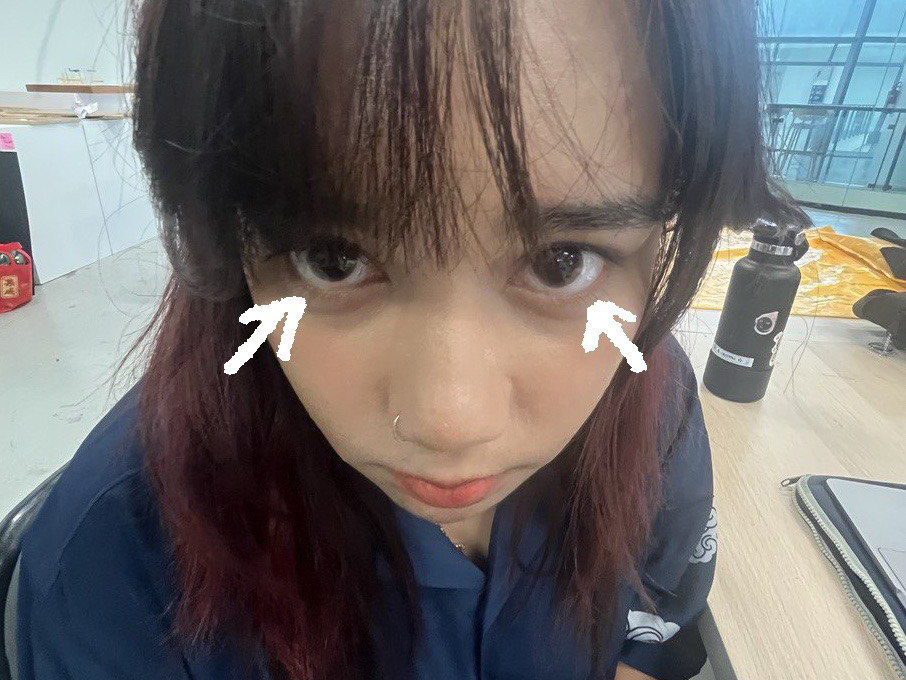
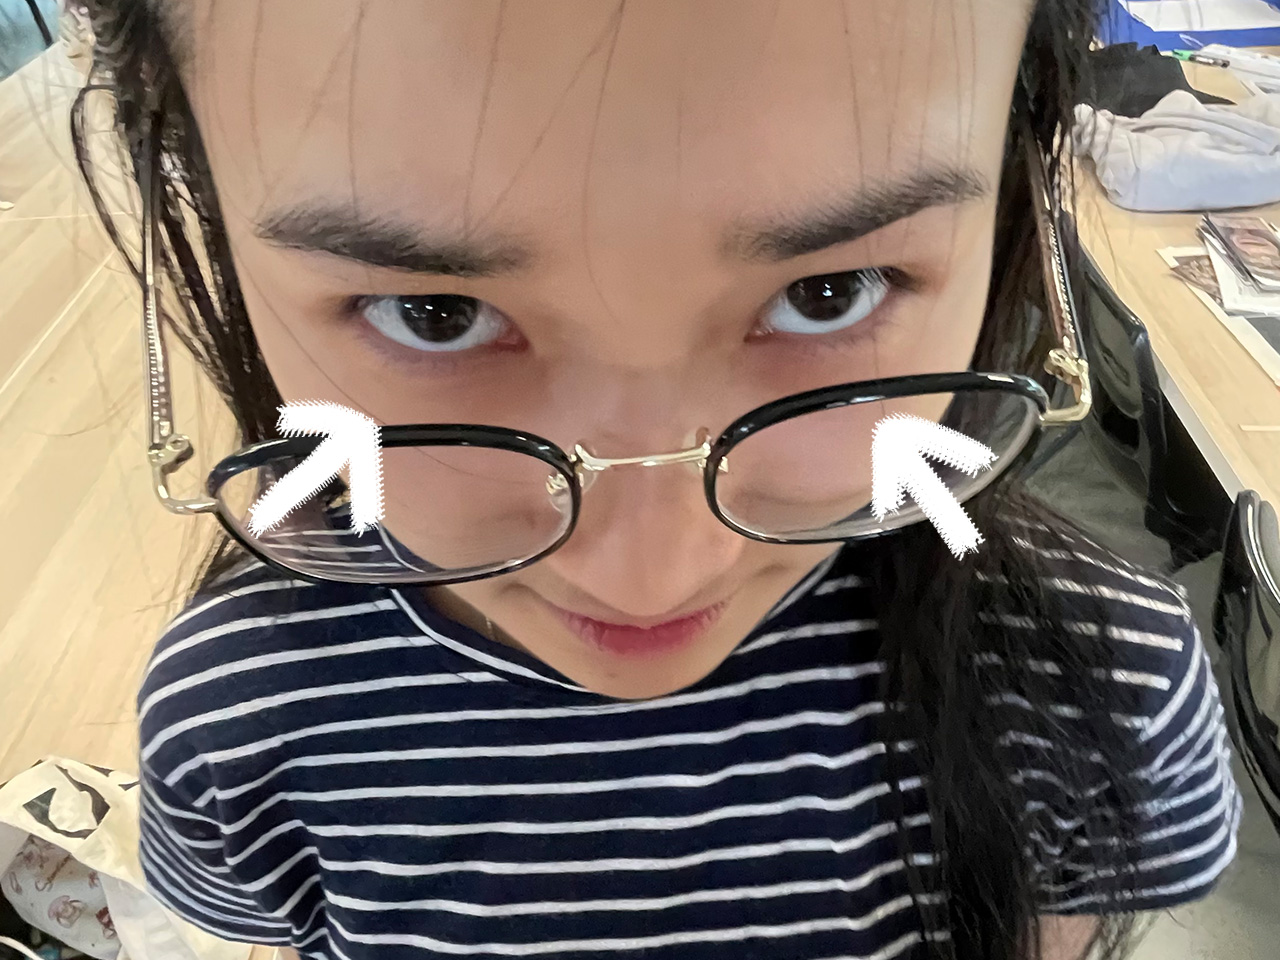
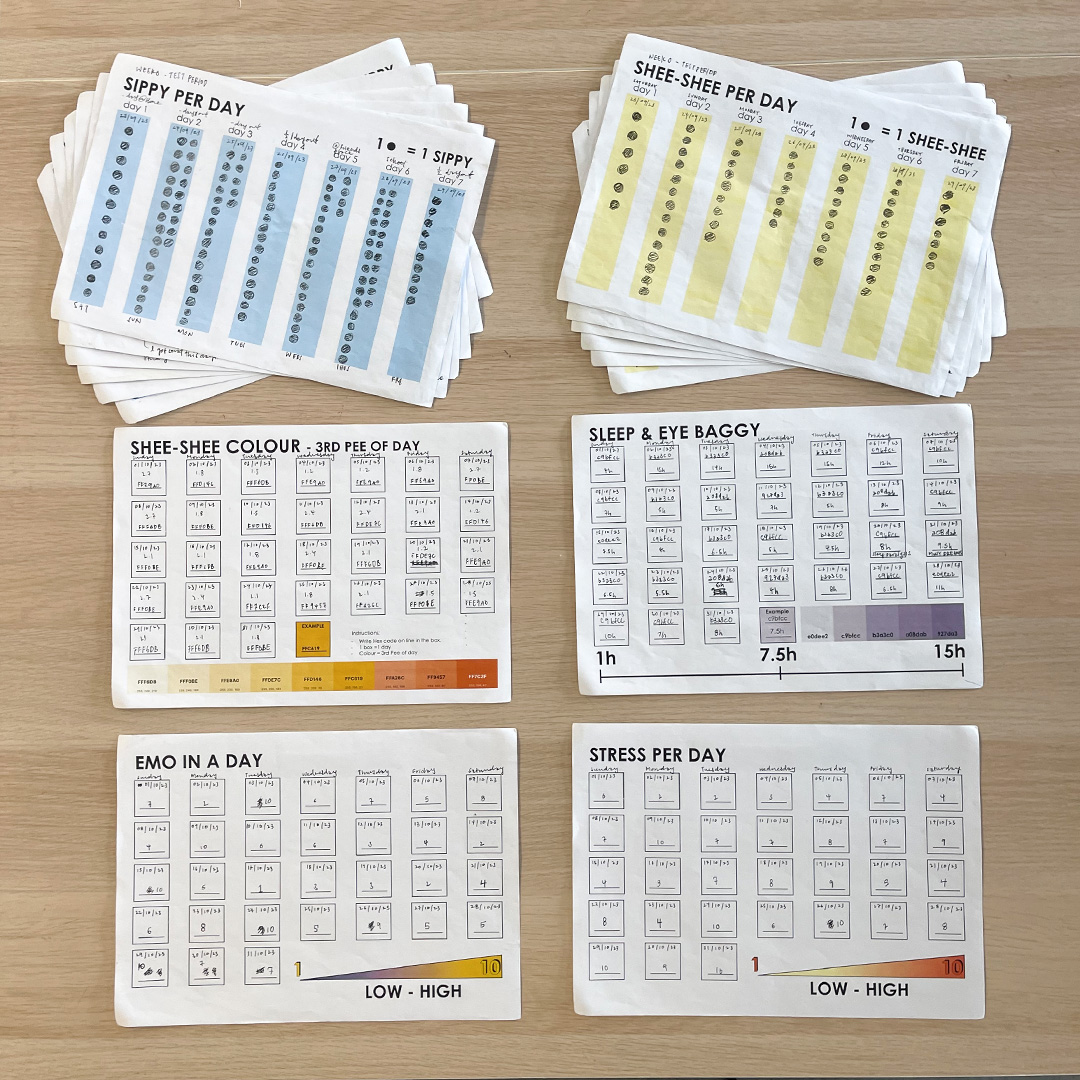
We continuously collect a variety of data sets that provide insights into our well-being every day. These include the frequency and color of our third pee, water intake, sleep duration, eyebag color, stress level, emotion level, and hair fall.
Our hands-on approach includes manual notation on a data sheet template, followed by a careful transfer to a spreadsheet for numerical calculation. Pee frequency is calculated by multiplying occurrences by 300 ml, and color analysis includes shades of yellow and distinct hues throughout the menstrual cycle.
Water consumption is calculated by multiplying the recorded amount by 100 ml. Sleep duration is logged in hours, while eyebag color is identified within the spectrum of purples. Stress and emotion levels are measured on a scale of 1 to 10.
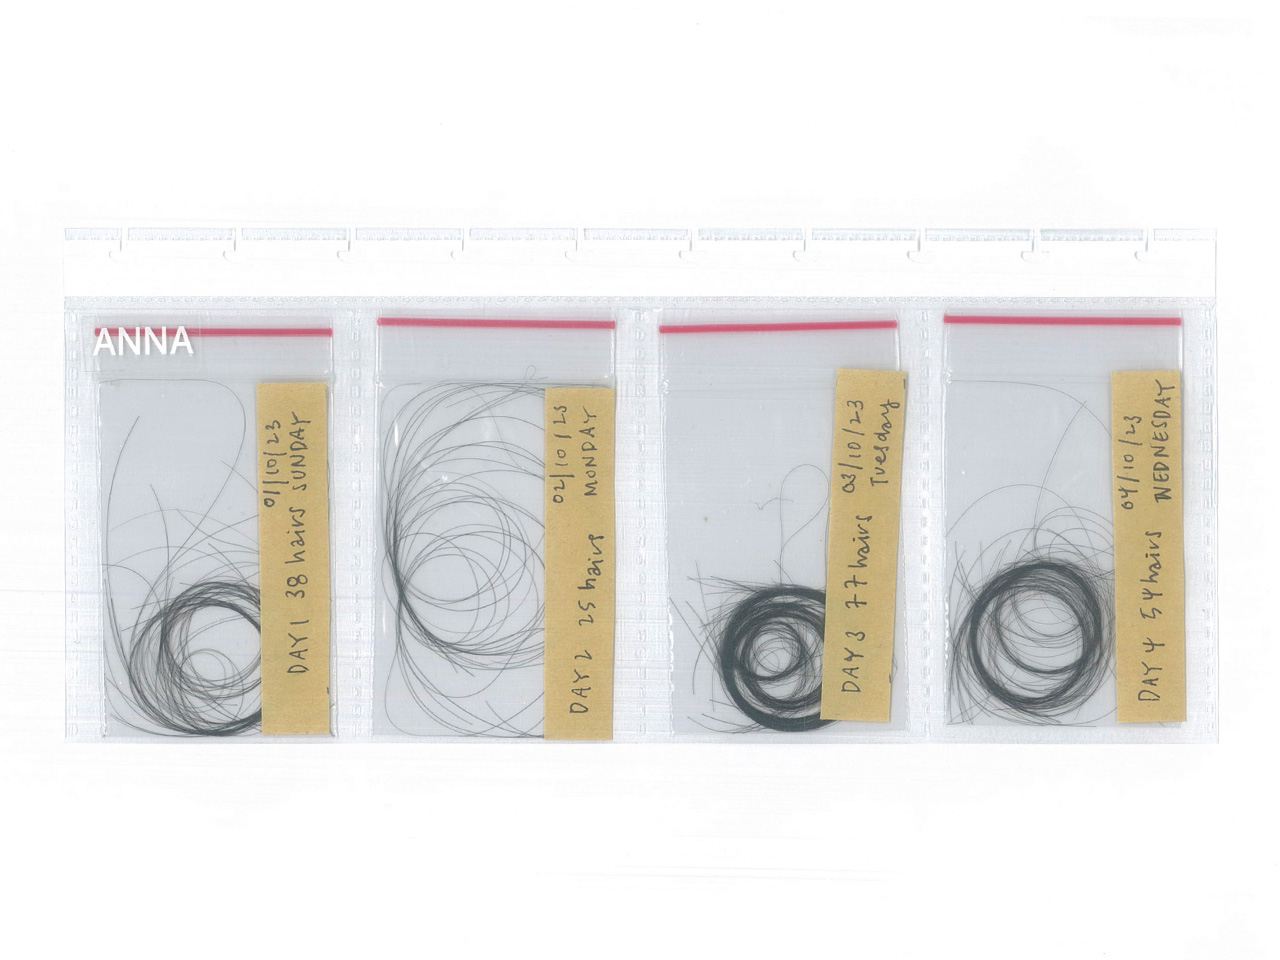
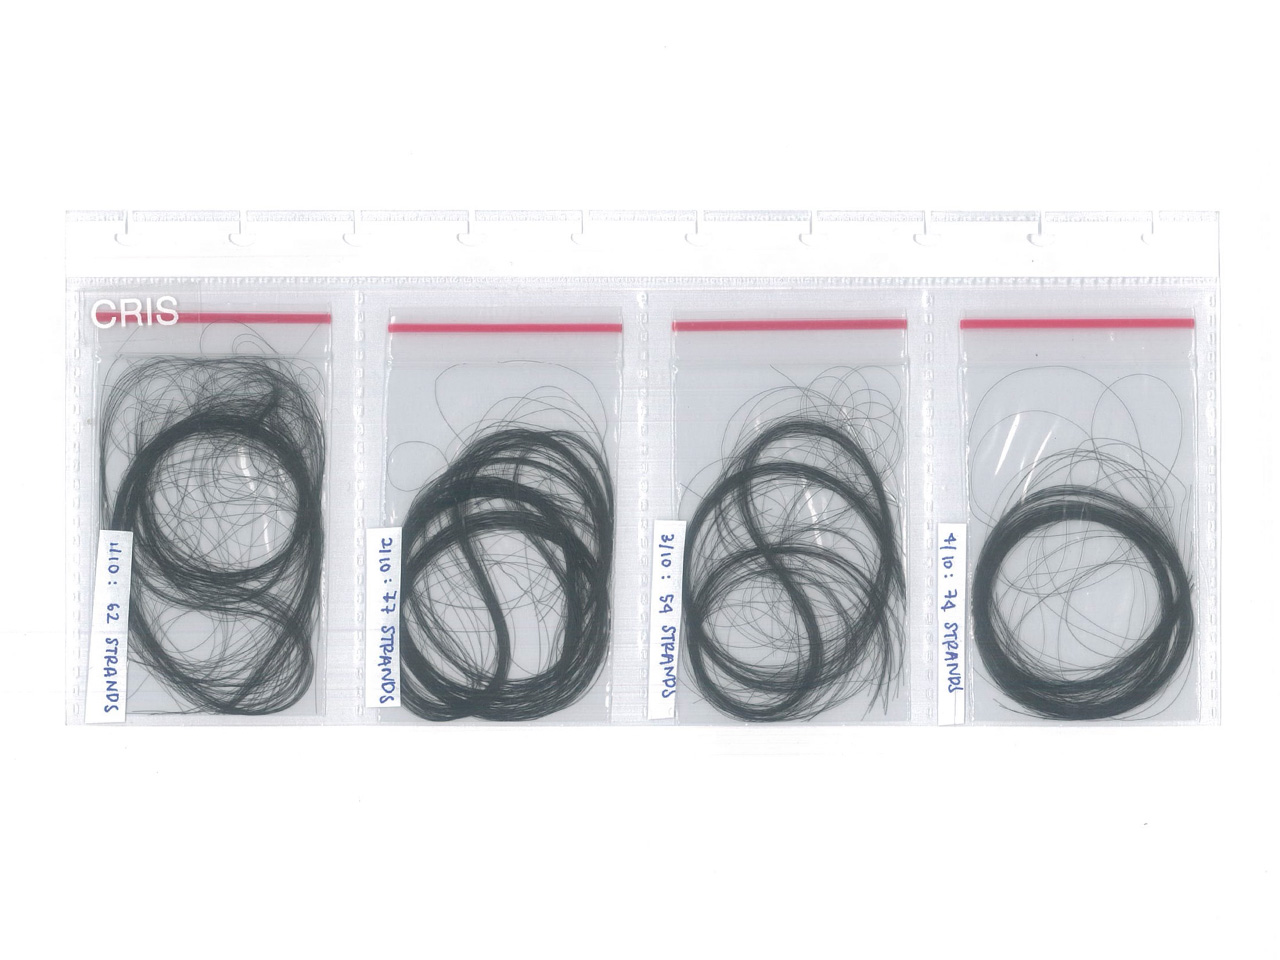
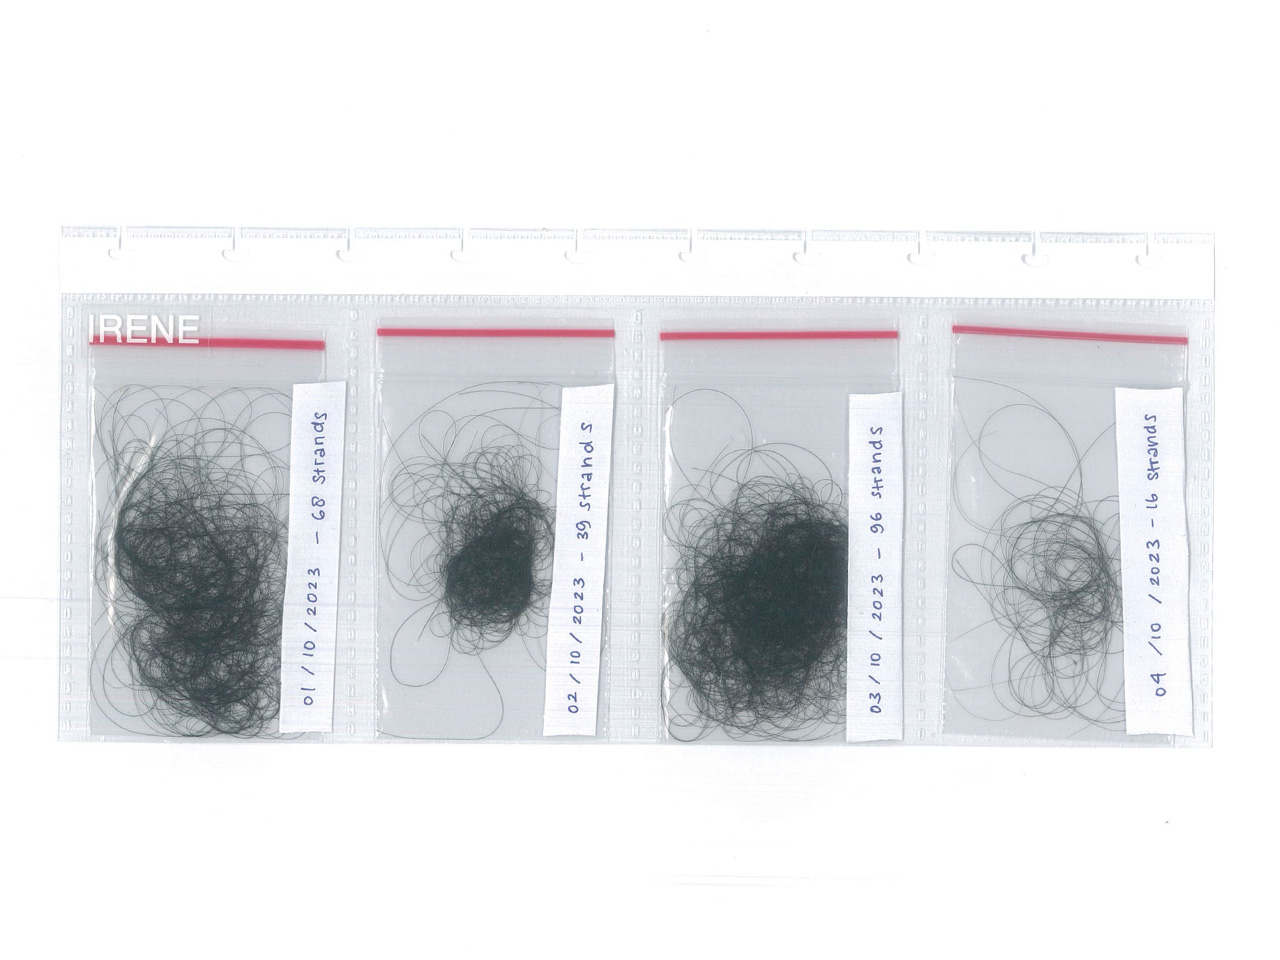
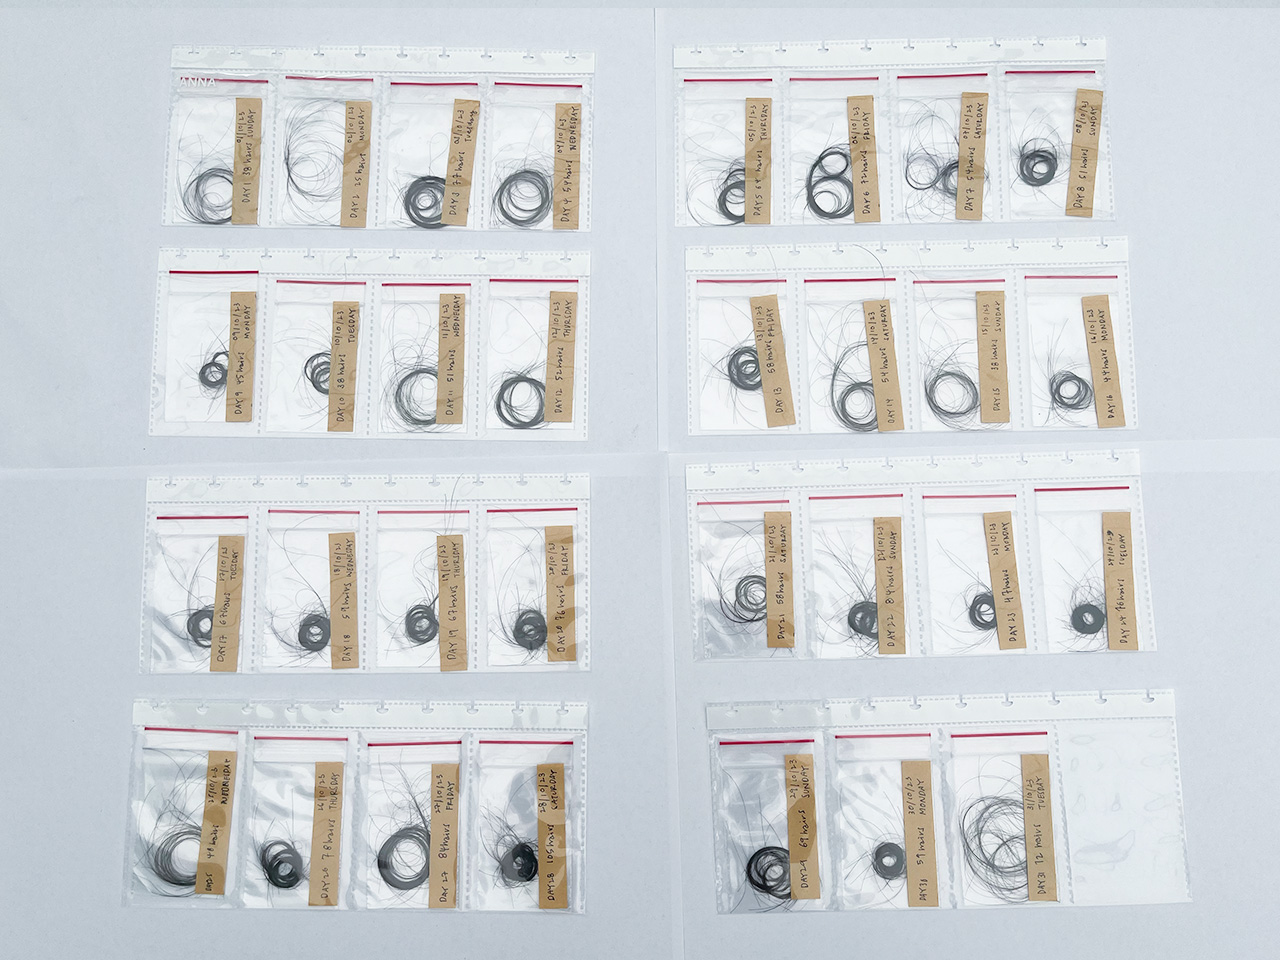
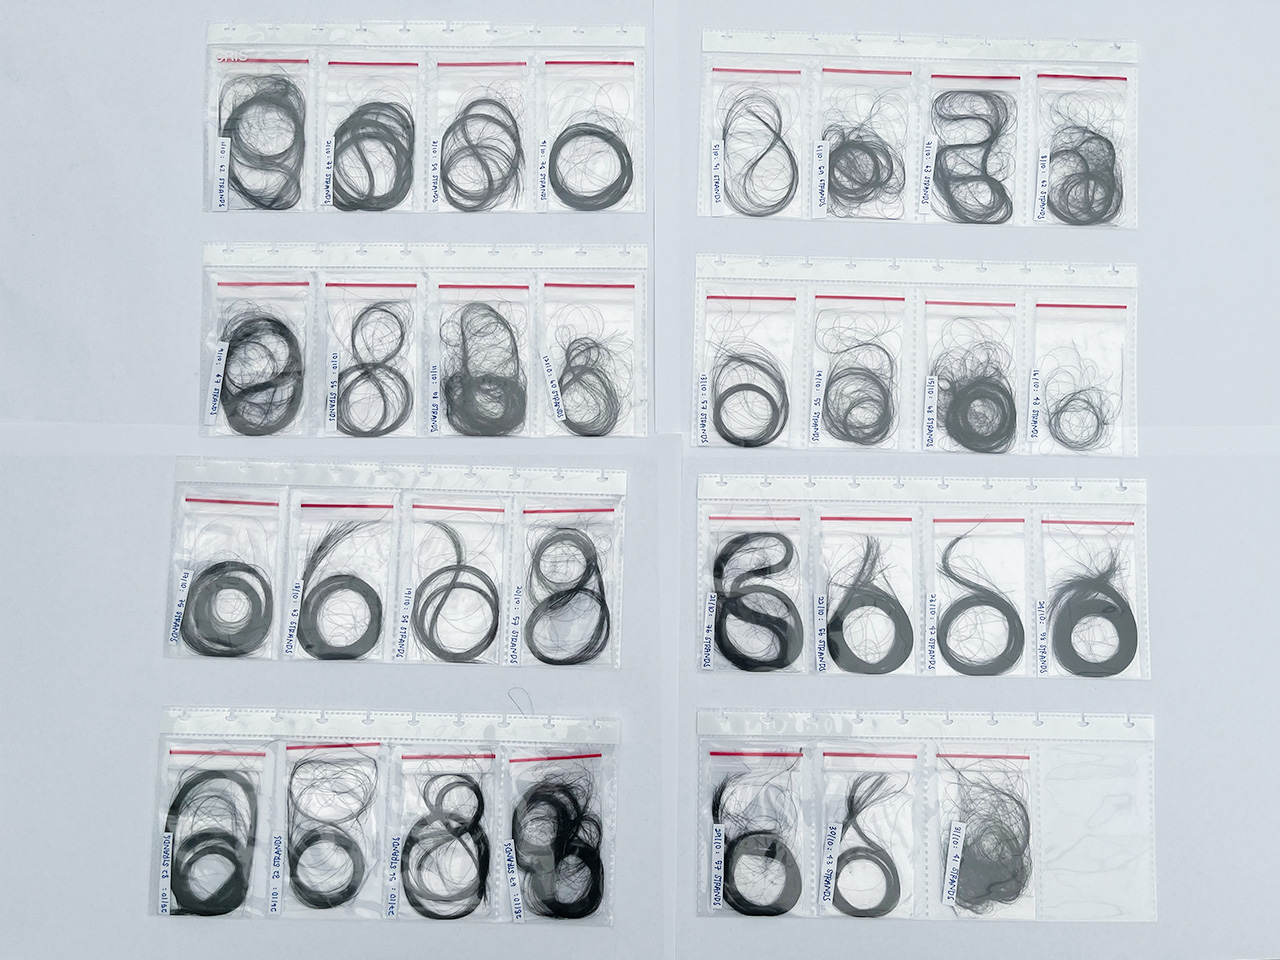
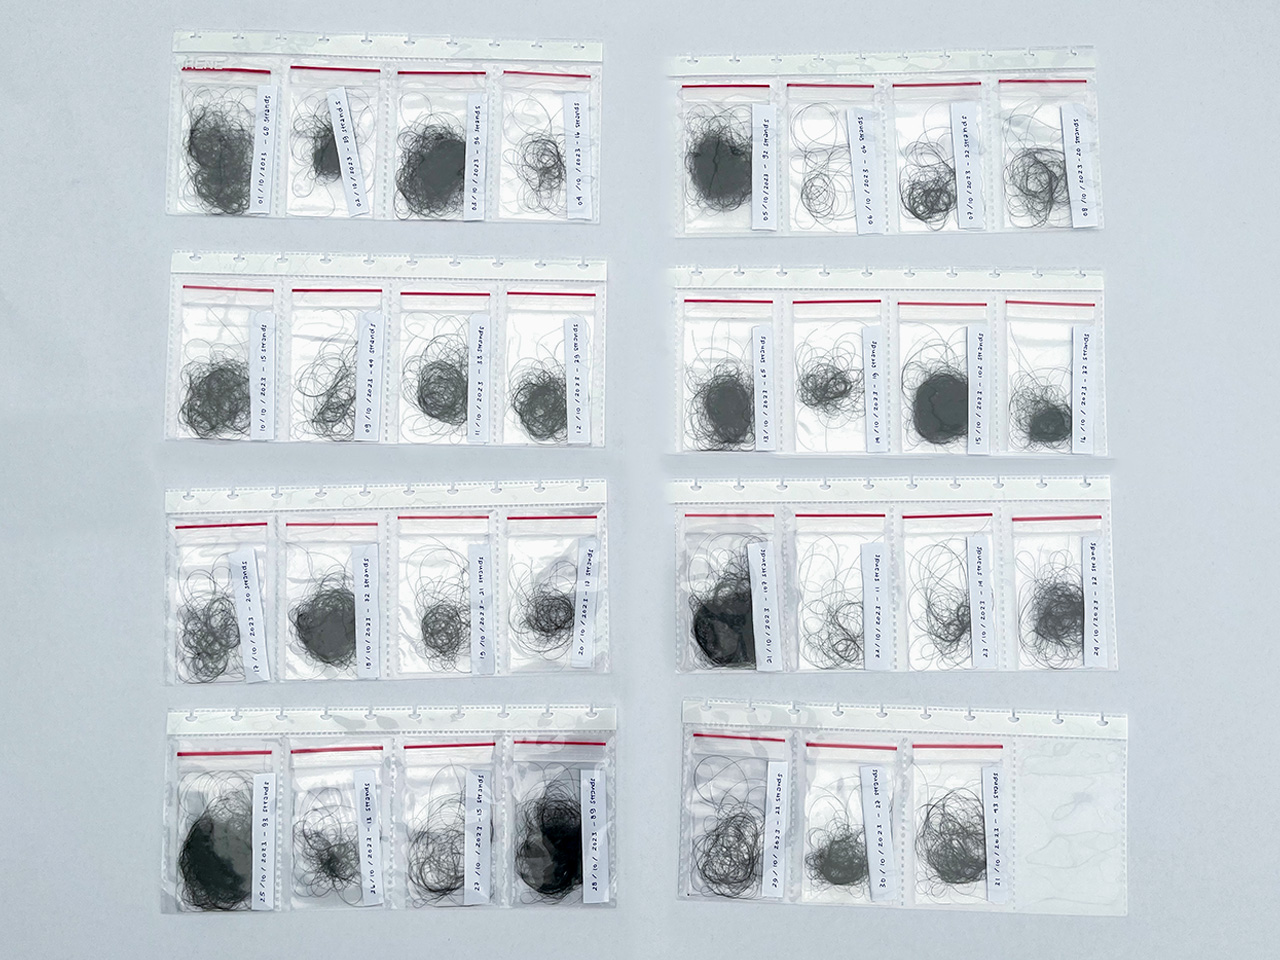
Notably, the daily count of hair fall is thoroughly documented and physically archived in a plastic file, serving as a tangible artefact in this in-depth examination of everyday experiences.
Artefact
Coming up with ideas for our project was tough until Andreas helped us break free from clichés. We decided on a unique artefact—a publication featuring comic strips that vividly portray our daily experiences in October. Divided into morning, day, and night sections, each comic is drawn by each of us with our own unique style. Embedded in the comics are "easter eggs" reflecting our collected data, like how much we drink, pee frequency, the color of our third pee, sleep duration, eyebag color, stress, and emotion levels.
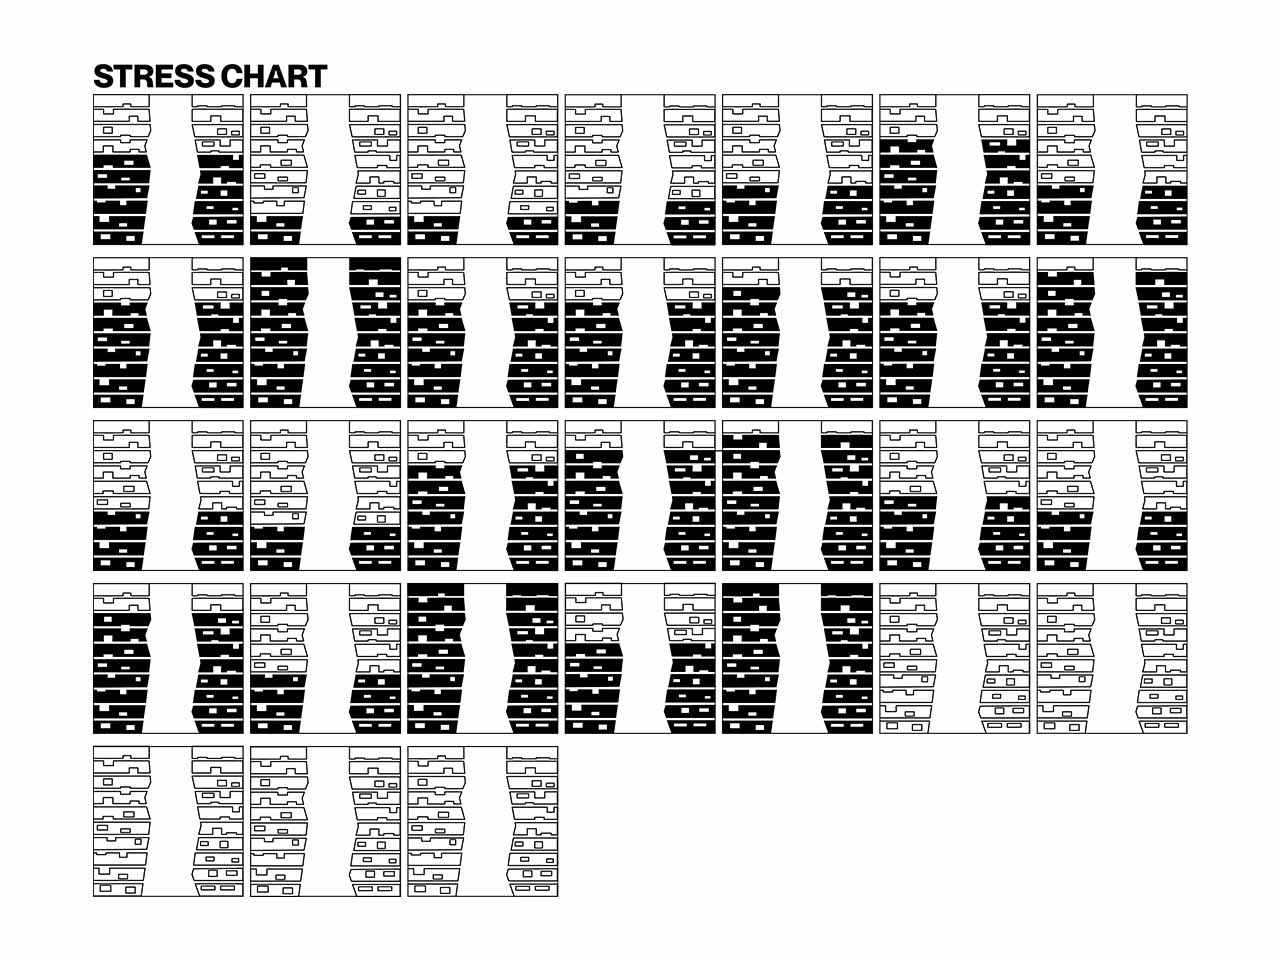
The comics get creative with representations: volumes of pee and water are shown in four-liter bottles, using shades of pee and blue water; sleep hours are shown by eyebag colors; stress levels use squiggly lines; and emotion levels are expressed with green lines. This blend of art and data not only tells a personal story but also invites readers to find hidden information. We created everything digitally using ProCreate on iPad, using pre-designed comic grids from Adobe Illustrator. Alongside the comics, we added personalized numerical designs that contain our raw data and a poster-style compilation of our data, each reflecting our unique style. This compilation is a condensed record of our collective journey.
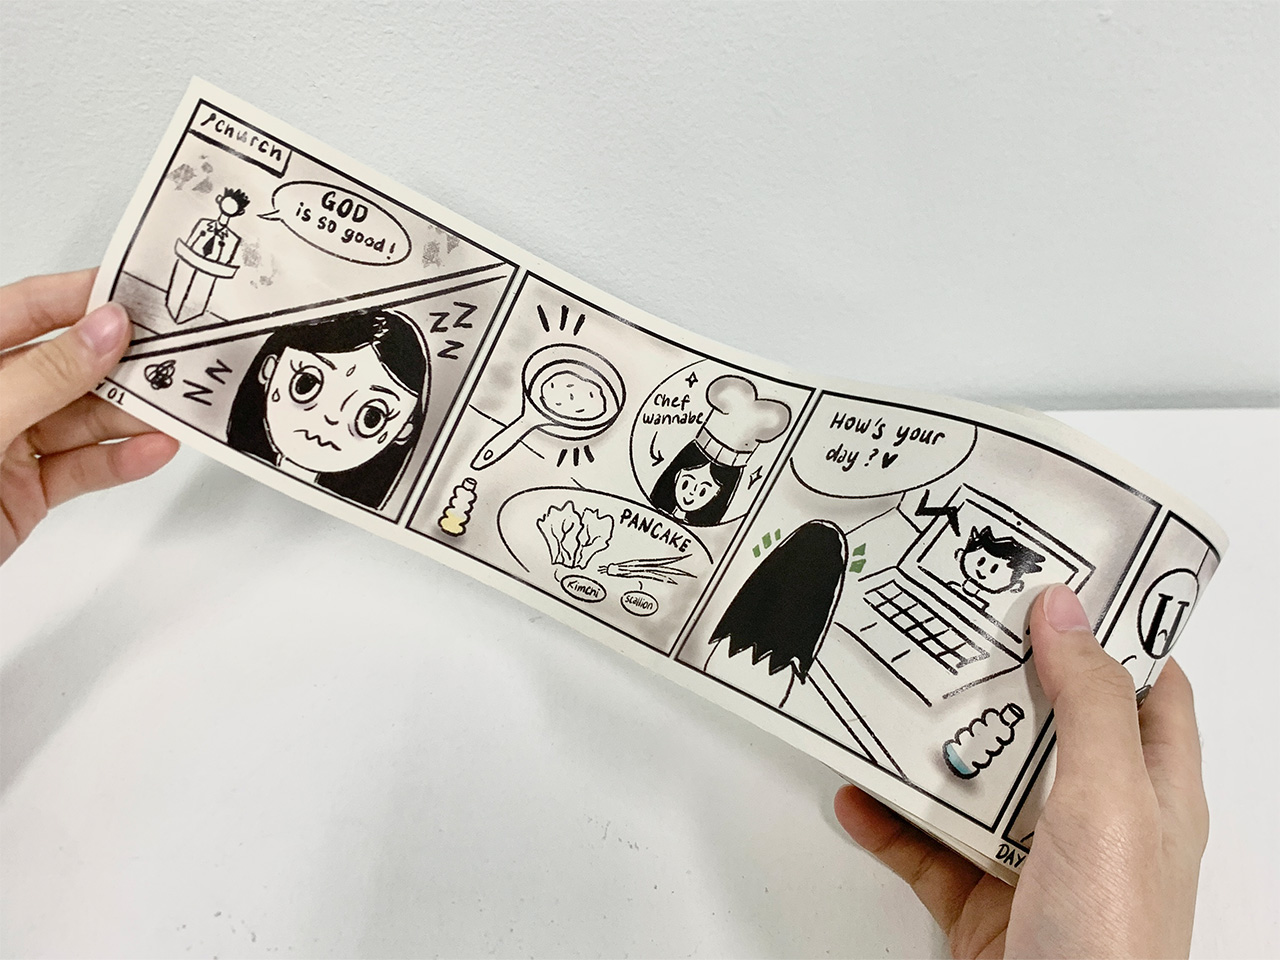
We also attempted to convert the comic strips into a toilet paper roll format that corresponded to our shee-shee data. While it appears to be one-of-a-kind and amusing, we chose the publication as our main artefact because it is more effective.
Conclusion
As we sought the perfect project, we grew weary when our first ideas didn't pan out, which were doodles on transparency film and sketches of our daily lives that didn’t represent our data well.
Taking advice from our lecturers, we shifted gears, turning our data into comic strips—three grids for each day. The final publication, which features various styles and personal stories, reflects our difficult journey.
We also transformed our initial basic poster into a coordinated comic design to match the overall comic vibe of the artefact. Beyond its looks, this project has brought each of us together, inspiring healthier habits for better data and well-being. The publication is not just a showcase of creativity but also a catalyst for personal development.
